bits by luke
Is Sentry slow in Node?
I recently deployed Sentry’s Node SDK to improve our system observability. The deployment increased our service’s CPU by an unexpected 6% to 17%, depending on the time of day. All monitoring systems incur a cost, but 17% is an insanely high tax. Any such tool is only useable if the additional load remains in the low single digits. Let’s see if we can decipher what is happening to the poor CPU, and if the situation can be amended.
Beating the CPU to death
Sentry is a tried and true observability tool that I’ve leveraged for nearly 10 years. Out of the box it provides excellent error capture metrics, wrapped neatly behind an intuitive UI. In recent years the sentry team has expanded their offering to include tracing, profiling/performance, session capture, and RED/Golden metrics tracking.
This is my first time leveraging sentry for a Node service. I frequently work with the JVM (clojure) or the BEAM (elixir), and have had no issues with their official sentry sdks. Unfortunately, the Node sdk– like most things in the Node ecosystem, is full of surprises.
A few hours after releasing a “default” sentry configuration I noticed a dramatic increase in CPU usage across all instances of our service. Consider the pink line in this chart compared to the green line, which is an overlapping time window from the previous day:
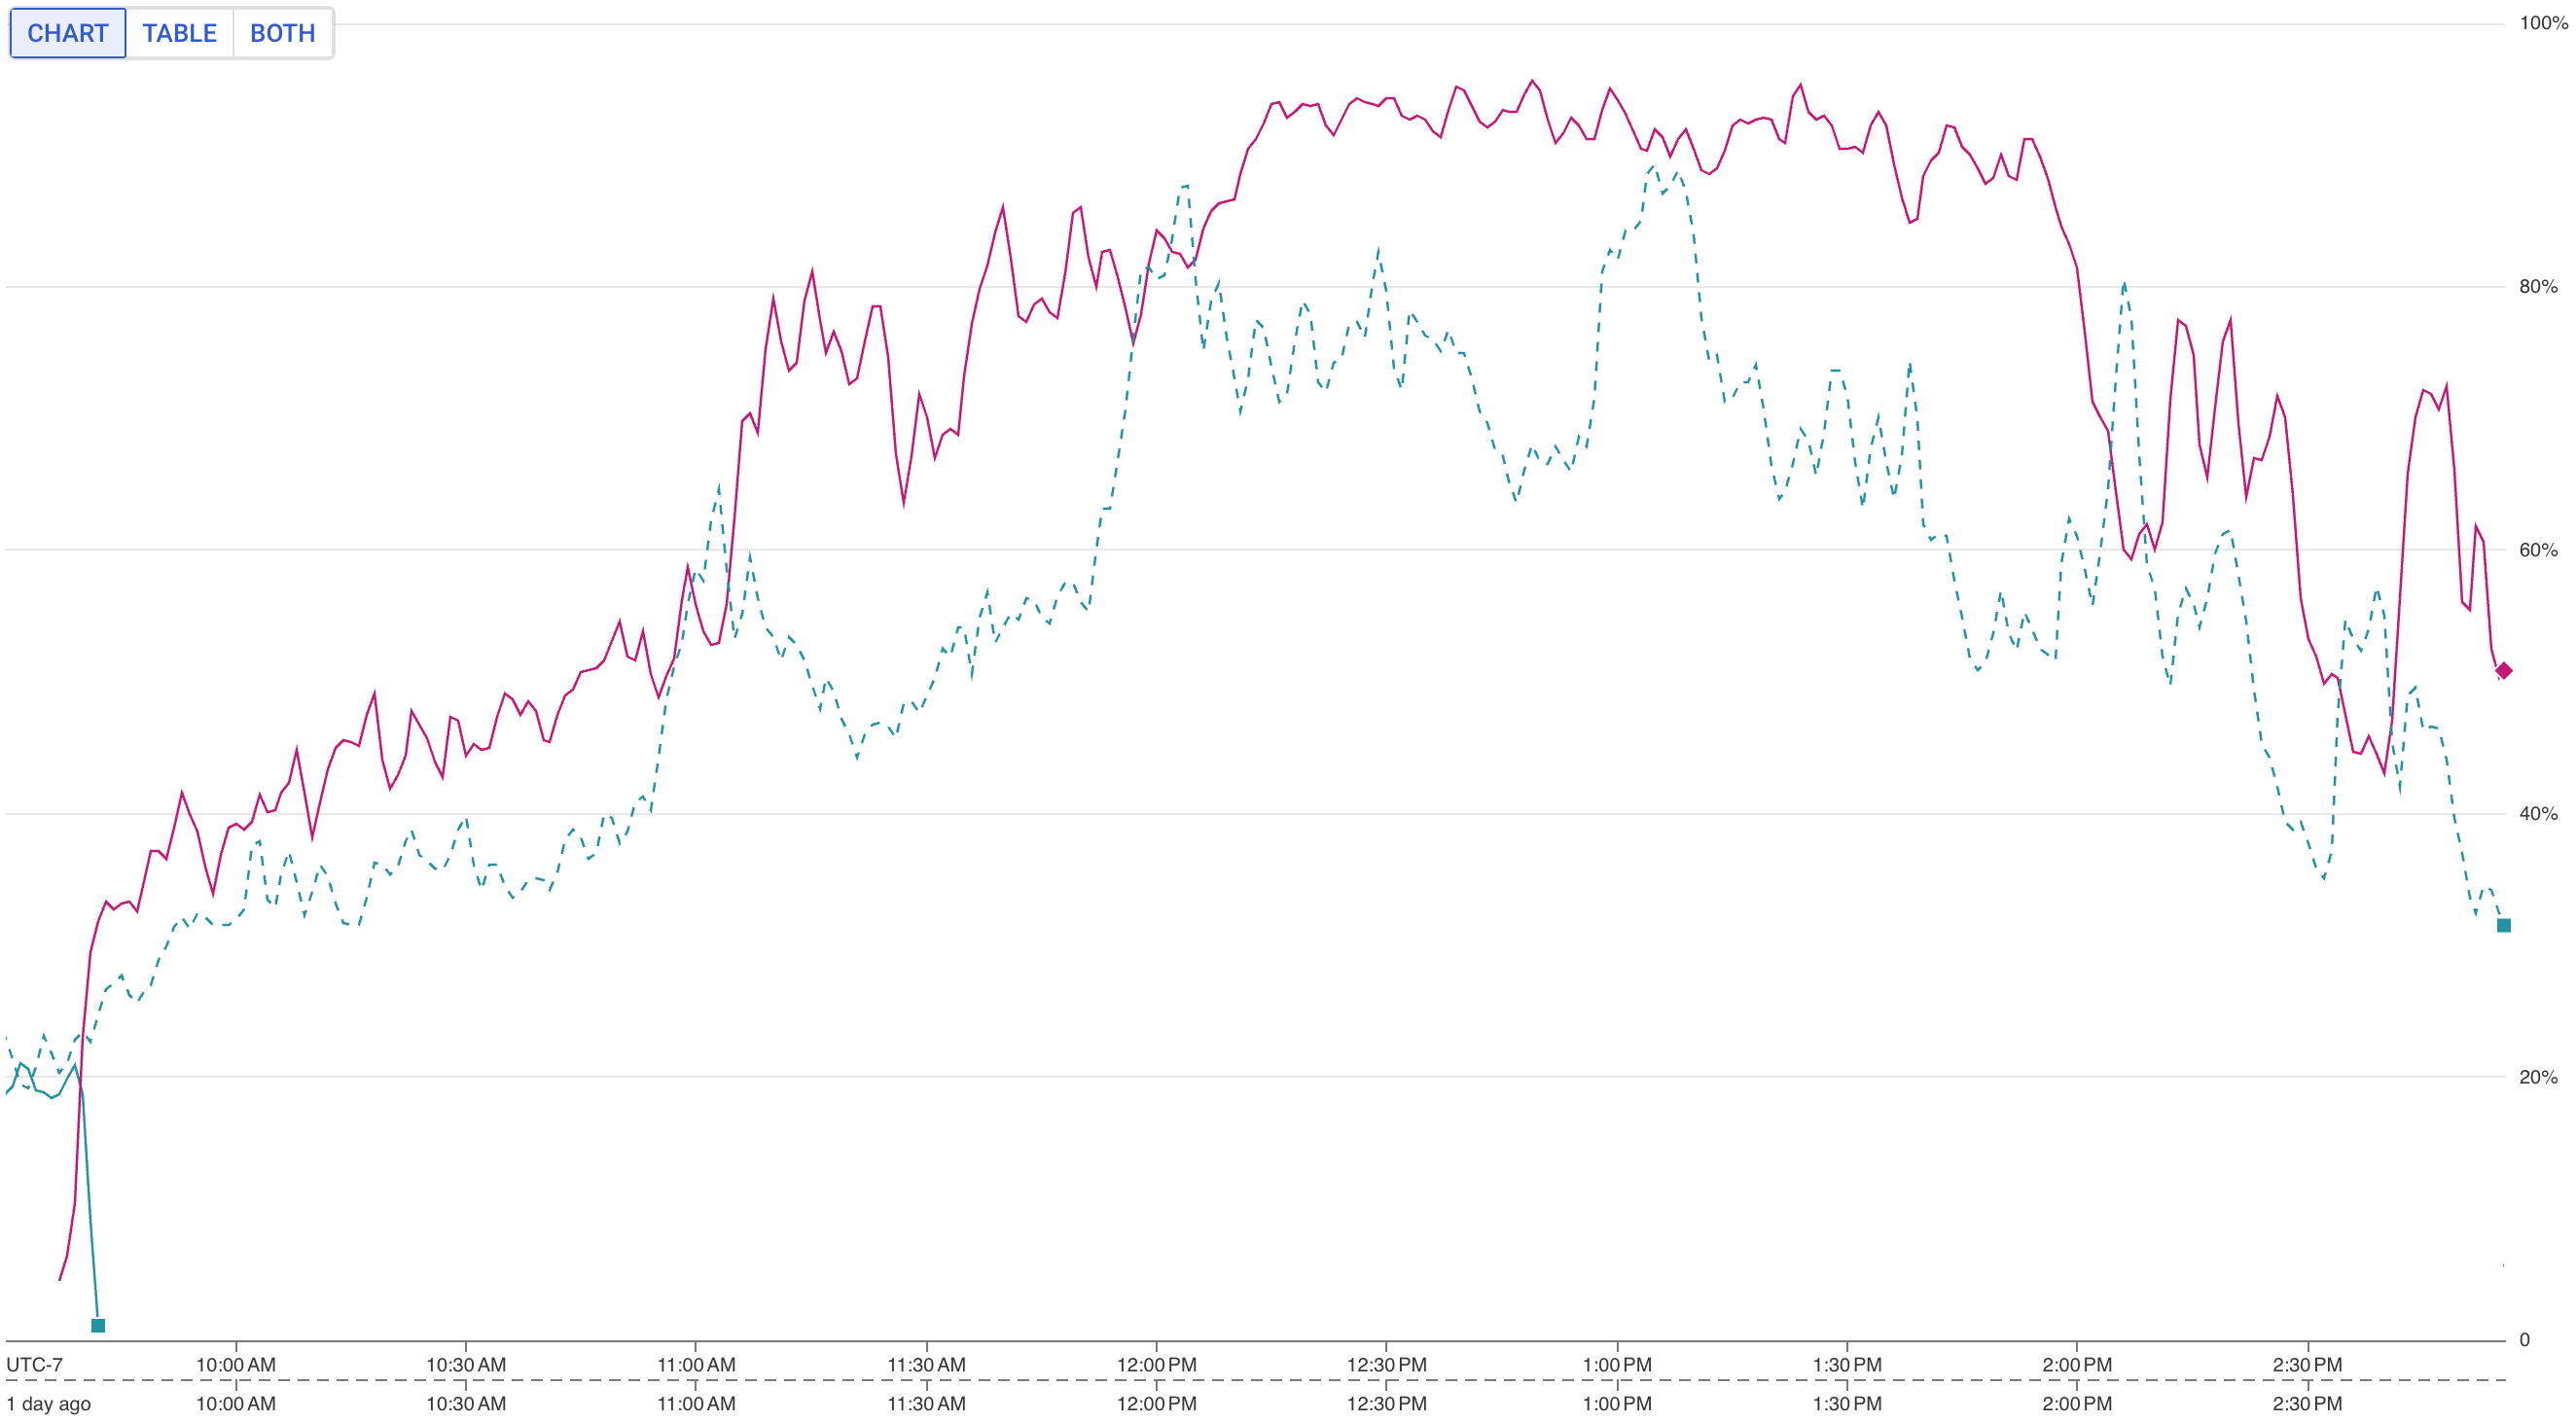
The CPU climbs to >95% more than a few times. Oops. Let’s see if we can rescue this CPU from my incorrect assumptions.
The first knob to turn with sentry is often tracesSampleRate. My hypothesis is
that we’re sampling traces and profiles with too much frequency, and the CPU
simply cannot keep up with all that extra work. I will happily trade
trace/profile volume for a reduced CPU workload. Debugging often only requires a
very small handful of traces anyway.
I plan to deploy a much lower sample rate and monitor the CPU for a few days. The expectation is that the CPU’s behavior will stabilize over time. Perhaps there are caches to warm up, or my initial sample data was slightly skewed from a normal day’s load.
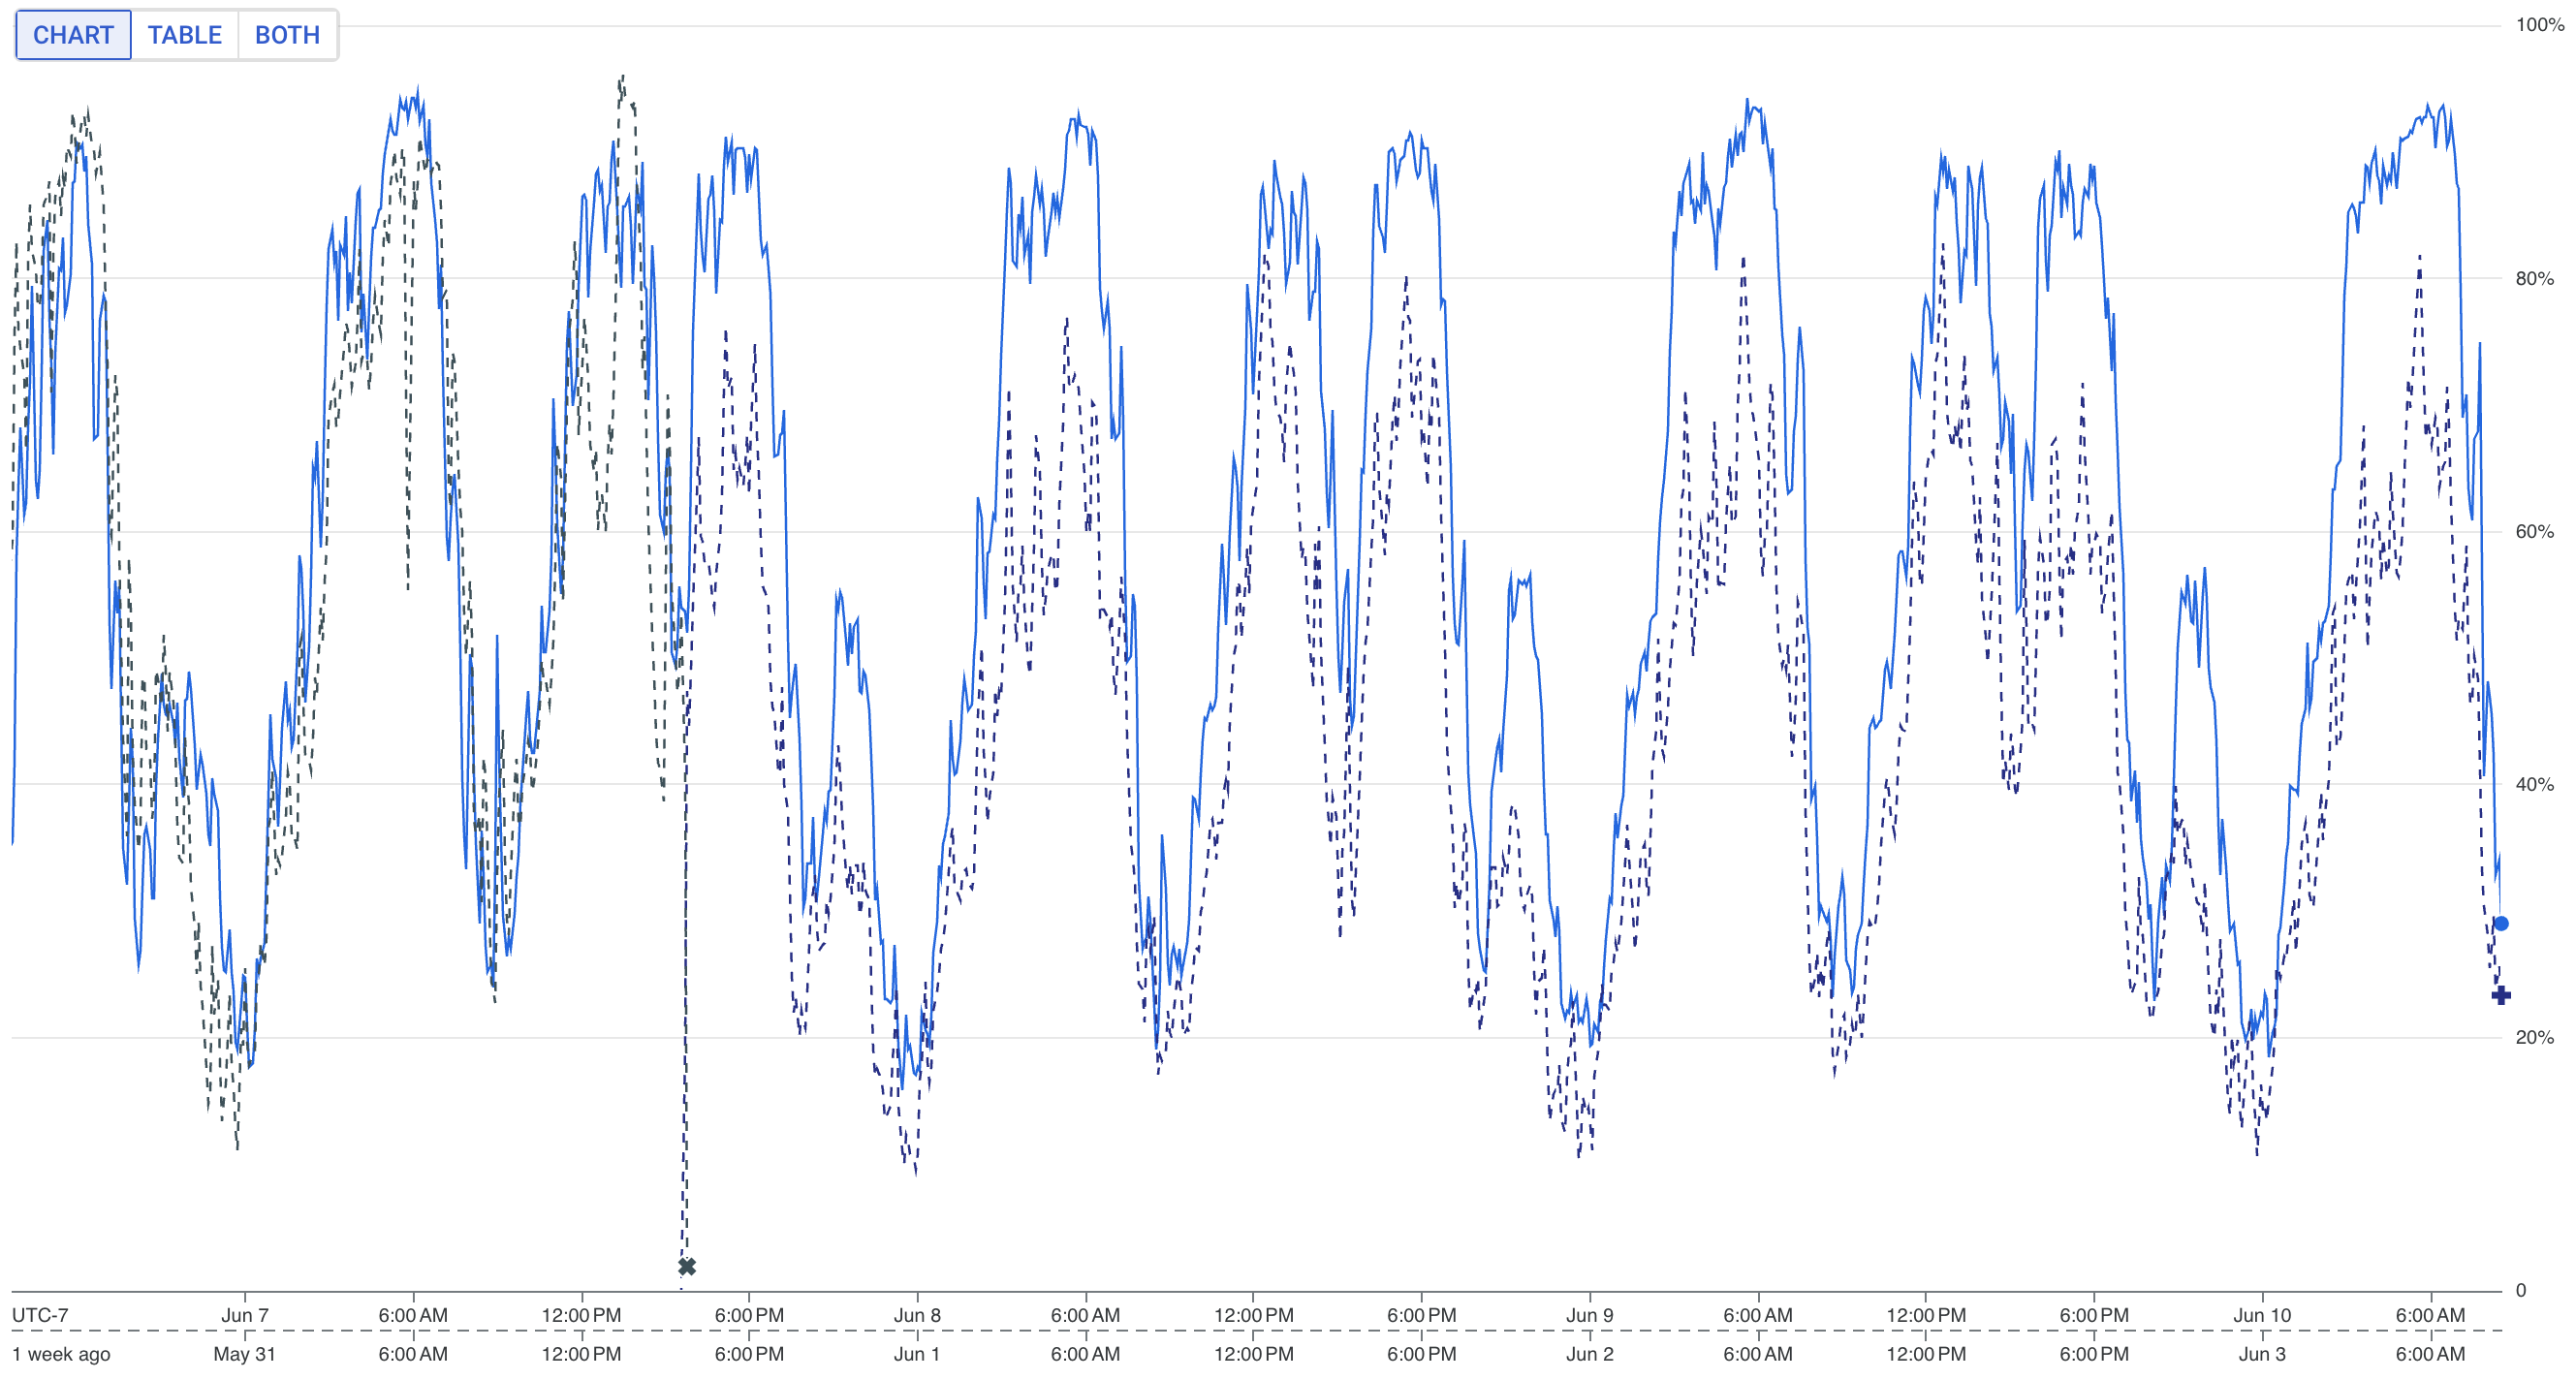
This was wishful thinking, of course. After a few days I became increasingly nervous that usage was still too high at ~90% during peak hours. Here is the chart for CPU usage over a ~4 day period. That blue line is a really big problem.
At this point we’re in a bit of a pickle. The tracesSampleRate has already
been turned down very, very low. During non-peak hours we receive barely a
trickle of telemetry from sentry. During peak hours, however, we’re still
utilizing far too much CPU to complete the tracing/profiling work.
The sentry team provides an excellent escape hatch for these types of
problems: a tracesSampler function. We can leverage the function to sample
at-time CPU usage and react dynamically with a trace/don’t-trace decision. This
allows us to use a slightly higher sample rate, and to turn that rate down
during times of high load.
function tracesSampler({ tracesSampleRate }) {

  // https://docs.sentry.io/platforms/javascript/configuration/sampling/
  return function(context) {
    // returning true is equivalent to 1, false is equivalent to 0, and
    // everything between is a percentage-based decision.
    let load = getCPULoad()

    if (load > 1) {
      // turn off sampling if we're thrashing CPU
      return 0
    }

    if (load > 0.9) {
      // this is critical usage cpu, nearly turn off our sampling
      return tracesSampleRate * 0.1
    }

    if (load > 0.75) {
      // this is too much cpu, cut our sample rate
      return tracesSampleRate * 0.5
    }

    if (load > 0.5) {
      // this is approaching too much cpu, slow our sample rate
      return tracesSampleRate * 0.75
    }

    if (context.parentSampled !== undefined) {
      return context.parentSampled
    }

    // use the default sample rate for all other cases
    return tracesSampleRate
  }
}
I hesitate to share the getCPULoad implementation. Node doesn’t put this kind
of programming close at hand, and it isn’t very well documented. What I’ve
managed to cobble together “works”, but it doesn’t feel like an officially
supported implementation. In certain environments (like Windows), this won’t
work at all. Additionally, it’s important to note that I am not an expert in
Node’s process model, nor its clustering implementation. There might be
multithreading consequences of the following which I do not fully understand.
For these reasons I have cordoned off this particularly piece of code into a
“safe” place where we knowingly cannot rely upon its correctness or
reliability.
function getCPULoad() {
  let current = performance.now()

  // cache the CPU load response for a bit
  if ((current - lastCheckTime) < 5000) {
    return cachedCPULoad
  }

  let currentUsage = process.cpuUsage()
  let userDiff = currentUsage.user - lastCPUUsage.user
  let systemDiff = currentUsage.system - lastCPUUsage.system
  let timeDiff = current - lastCheckTime

  // process times are in microseconds, convert our timestamp to microseconds
  // to get process load as a number 0-1.0.
  let CPULoad = (userDiff + systemDiff) / (timeDiff * 1000)

  // update the cache
  cachedCPULoad = CPULoad
  lastCPUUsage = currentUsage
  lastCheckTime = current
    ;[loadAvg1, loadAvg5, loadAvg15] = os.loadavg()

  logger.info(`[${process.pid}] tracesSampler CPULoad: ${CPULoad}, loadAvg1: ${loadAvg1 / 100}, loadAvg5: ${loadAvg5 / 100}}`)
  return CPULoad
}
Let’s take a look at the CPU for the dynamic sampling configuration:
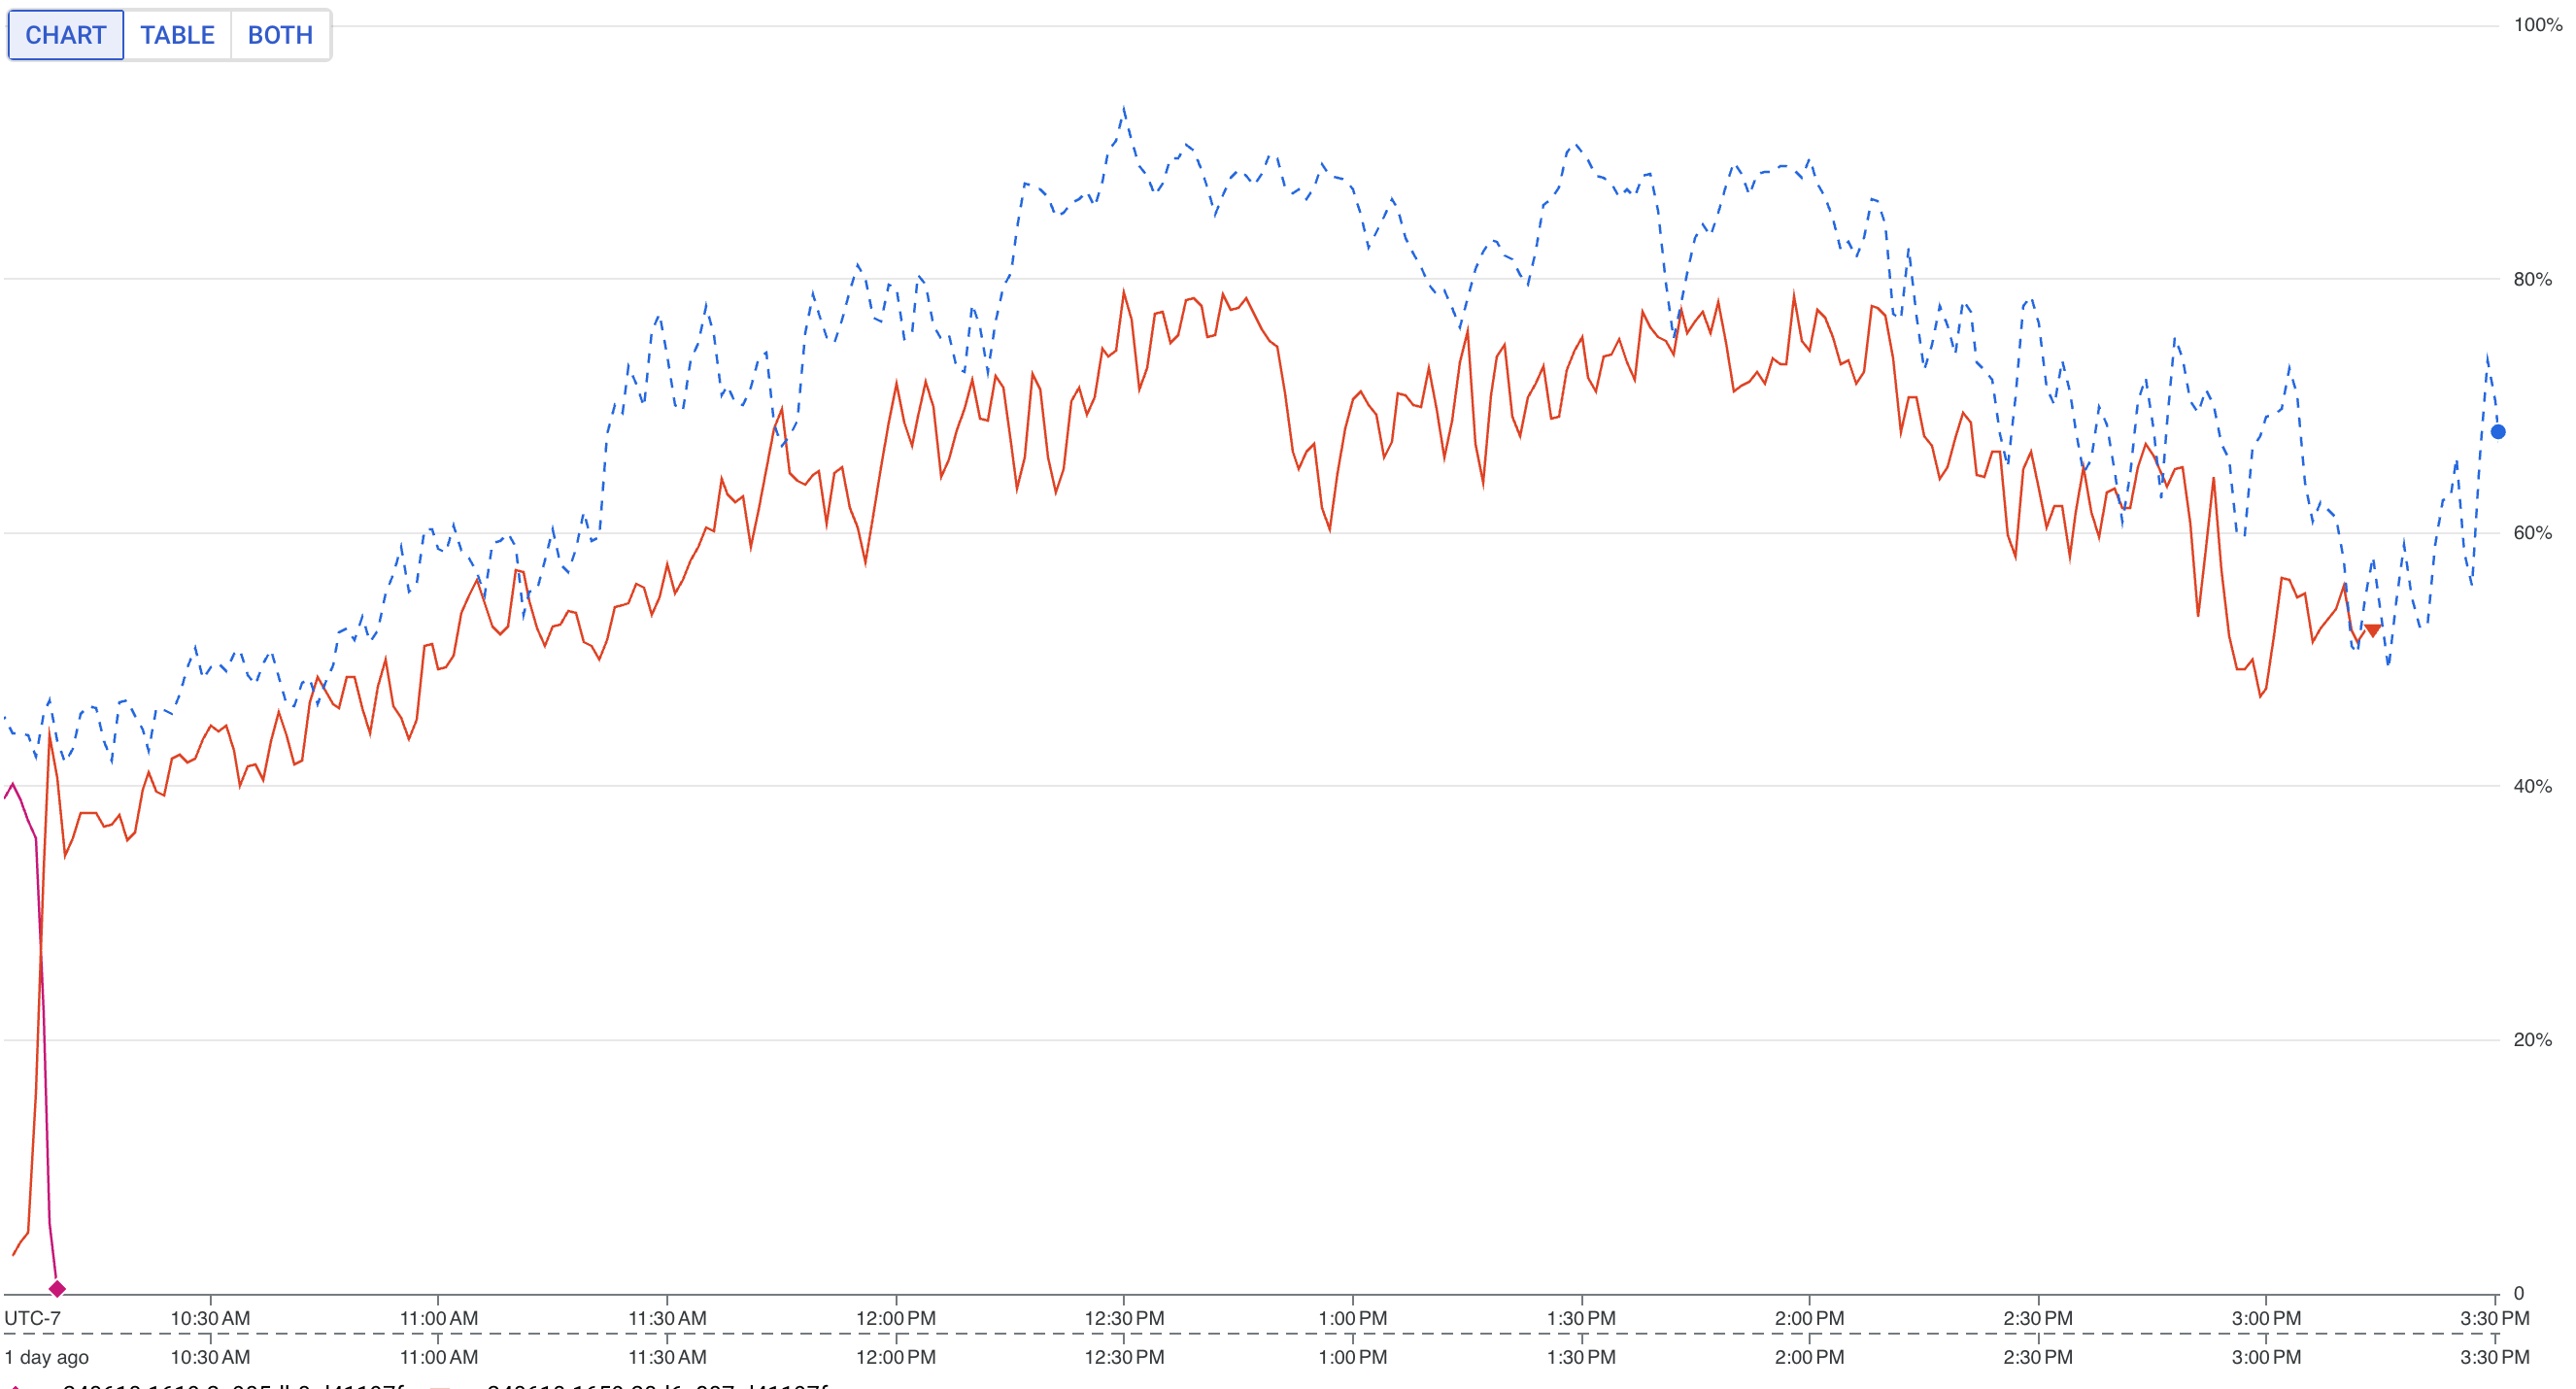
That orange line is looking quite a bit healthier. Importantly, the graph covers a full peak-hours period. The CPU topped out at <80%, which is a much better scenario than the previous configurations of ~95%.
Additional tricks
There are a few other levers to pull as it relates to Node’s performance with sentry.
tracePropagationTargets enables control over whether or not tracing
information is sent upstream. By default these headers are sent everywhere,
which seems like a strange configuration for both performance and security. Make
this an empty array [], or explicitly provide which downstream/upstream
services should receive these headers.
profilesSampleRate is relative to tracesSampleRate. For each sampled trace,
there is a profilesSampleRate chance that a full profile will be measured for
the entirety of that transaction. Profiling is never lightweight, so try turning
down this sampler.
ignoreTransactions can be configured to completely disable tracing for
particular events. If your application has high-volume, repeating, superfluous,
or extremely low-priority transactions, consider excluding them from sentry. I
was able to turn off a handful of long-polls and websocket connetions that, even
if they generated many errors, would not require any developer intervention.
Node is Node
Unfortunately, I think much of the Node ecosystem is riddled with footguns. It’s a bit disappointing that a tracing / profiling tool is so processor hungry, but it’s not unexpected for this environment. I don’t blame the sentry developers; javascript and v8 simply don’t have the mechanisms to control or tune this kind of code.
With some cloud-provider observation already in place, and a little patience, I believe the proper sentry configuration can still be a highly effective addition to any Node observability stack.